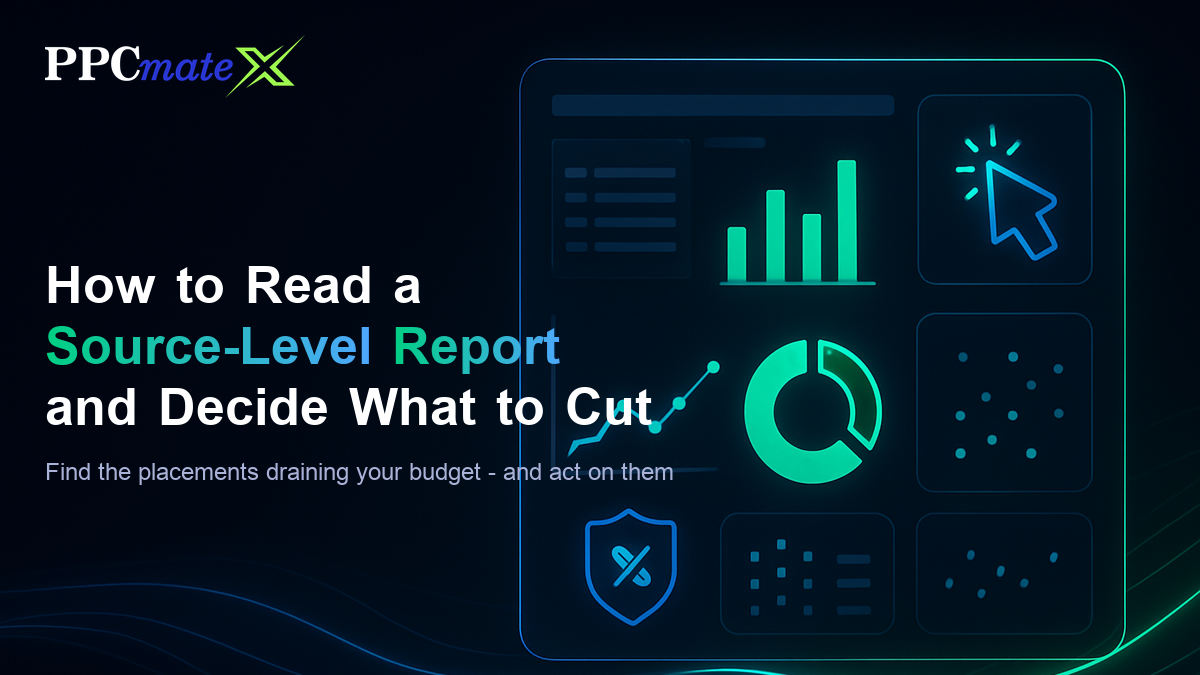
How to Read a Source-Level Report and Decide What to Cut
Every programmatic campaign eventually produces the same uncomfortable picture: the campaign total looks acceptable, but the money underneath it is spread very unevenly. Some placements are quietly carrying the campaign and some are quietly draining it. The source-level report is where that becomes visible, and reading it well is one of the highest-leverage habits a media buyer can build. This guide walks through what the report is telling you, the checks to run before you cut anything, and a decision framework you can apply to every row.
What a Source-Level Report Actually Shows You
A source-level report breaks a campaign down by the individual places your ads ran. Depending on the platform and the traffic type, a “source” might be a website domain, an app bundle, a publisher ID, a zone or a placement inside a site. Whatever the label, the principle is the same: one row equals one supply origin, and each row carries its own spend, delivery and result figures.
This matters because campaign-level numbers are averages, and averages hide the shape of the distribution underneath. A campaign that looks mediocre overall is very often a mix of a few strong sources and a long tail of weak ones. Until you look at the source level, you cannot tell whether you have a bad campaign or a good campaign with a spending leak.
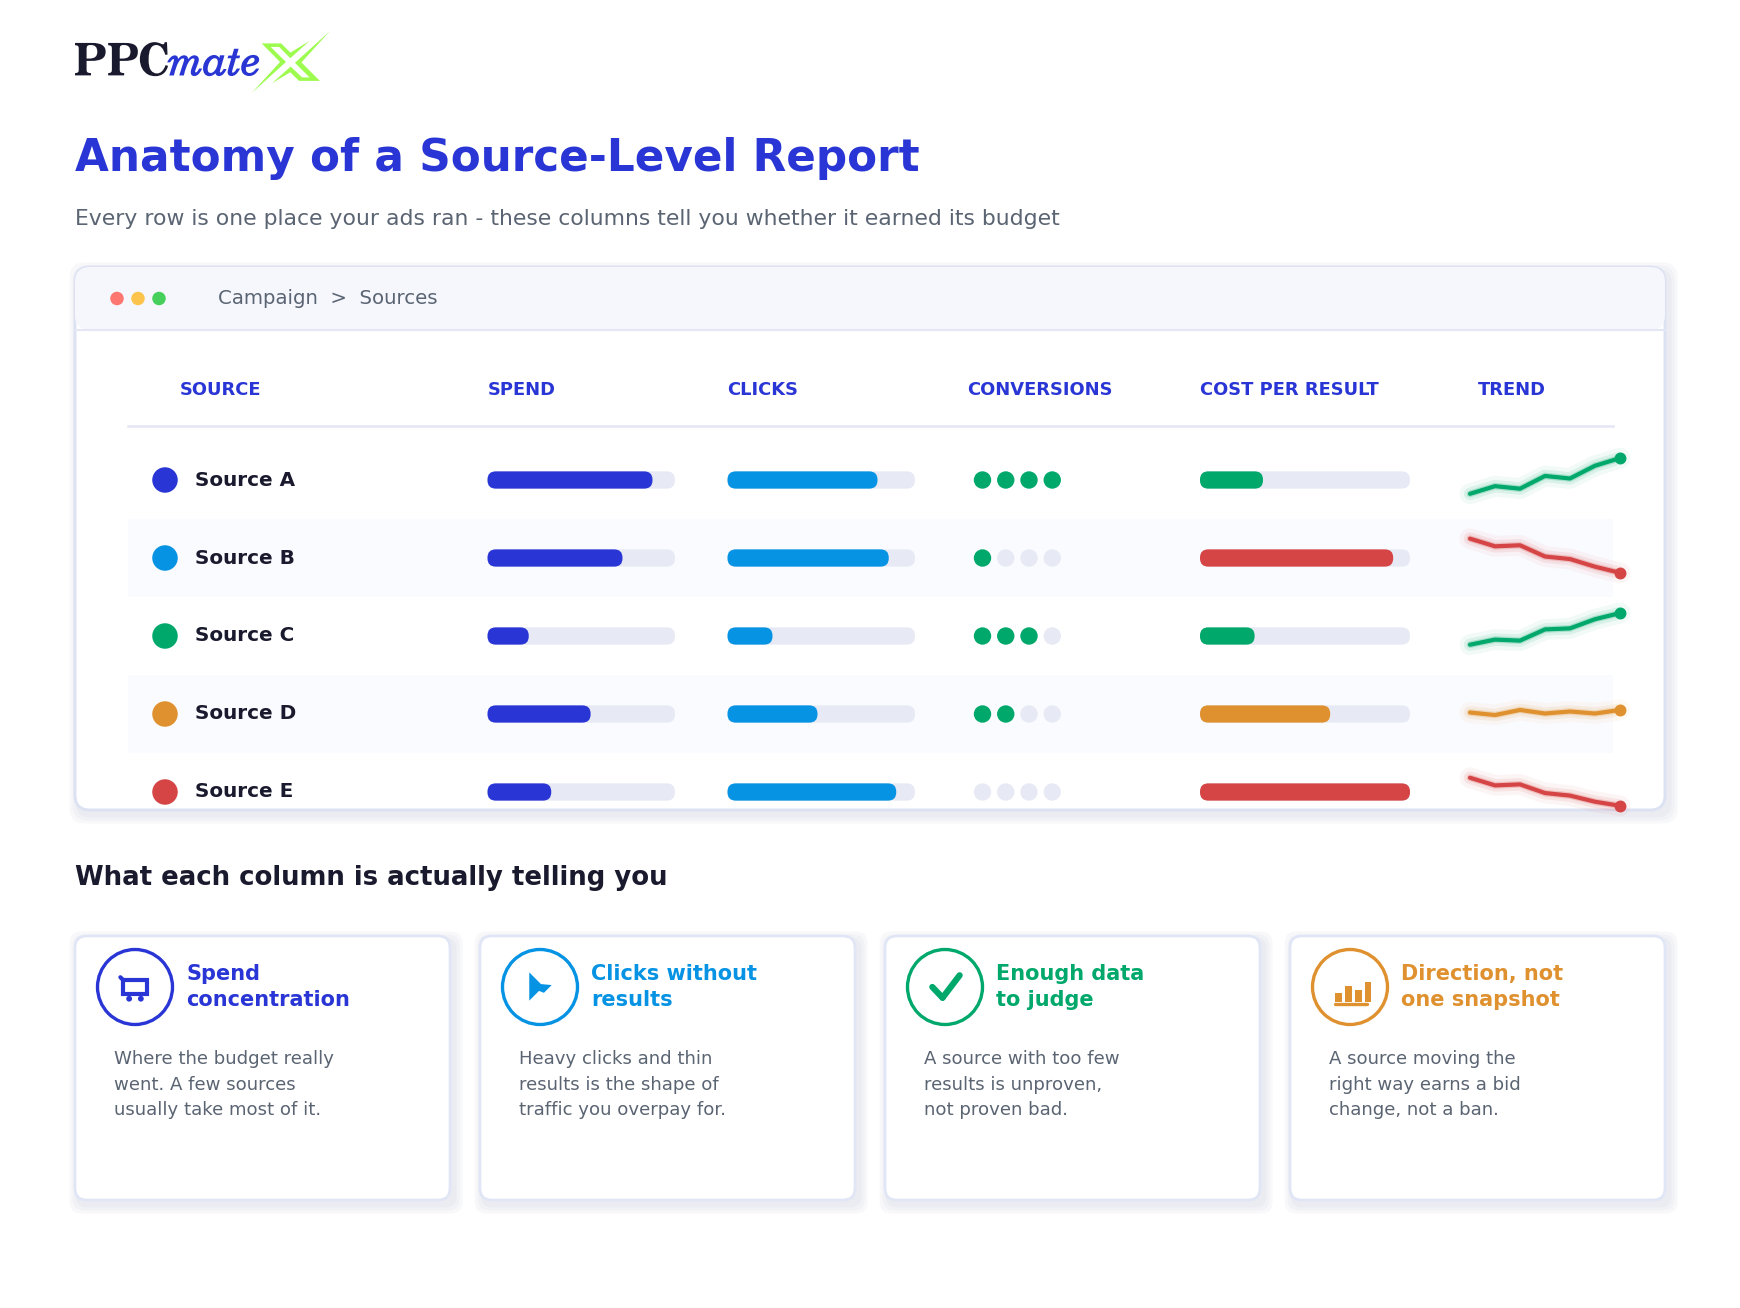
The columns that carry the decision
- Spend — the only column that tells you what a source is costing you. Sort by it first.
- Impressions and clicks — delivery volume, and the first hint of whether engagement is plausible for the format.
- Conversions or post-click events — the outcome you actually bought. Without this column the report can only tell you about traffic, not value.
- Cost per result — spend divided by outcomes, which is what you compare against your target.
- Trend over time — whether a source is improving, decaying or flat. A single snapshot cannot tell you this.
If your report is missing the outcome column, fix that before you optimise anything. Cutting sources on click data alone is guesswork, and it routinely removes cheap inventory that was converting perfectly well. Server-side postbacks or a properly wired tracking integration are what make the rest of this process meaningful.
Three Checks to Run Before You Cut Anything
The most common optimisation mistake is not cutting too little, it is cutting too early and on the wrong evidence. Three quick checks prevent most bad decisions.
1. Is the sample large enough to mean anything?
A source that has spent a trivial amount and produced no conversions has not failed — it simply has not been tested yet. Before you judge a row, ask whether it has had enough spend to have produced at least a few results if it were performing at your target rate. If it has not, the honest verdict is “unknown”, and the right action is to leave it running at a modest bid rather than blacklist it. Judging tiny rows as failures is how buyers accidentally prune away inventory they never actually evaluated.
2. Are you looking at a long enough window?
Short windows exaggerate noise. Daypart effects, weekday and weekend differences, and normal conversion lag all distort a one-day view. If your offer converts with a delay, a report pulled too soon will systematically under-credit recent traffic and make healthy sources look broken. Pick a window that comfortably covers your typical conversion delay, and use the same window every time so your comparisons stay honest.
3. Is the problem the source, or your setting?
A source can look terrible for reasons that have nothing to do with its traffic quality. A bid set too high makes good inventory unprofitable. A creative that does not match the placement context under-performs everywhere it runs. Missing or overly generous frequency capping lets a small audience see the same ad until it stops responding. Before you blame the supply, check whether you would get a different answer by changing your own settings.
How to Read a Source-Level Report, Step by Step
- Sort by spend, descending. Your biggest problems and your biggest assets are both at the top. The long tail can wait.
- Draw a line at your target cost per result. Everything above the line is a candidate for action, everything below it is working. Use your real business target, not a number you wish were true.
- Mark the rows with enough data to judge. Anything without a meaningful sample gets set aside as unproven rather than treated as a failure.
- Look at the shape, not just the total. Heavy clicks with almost no arrivals or conversions is a different problem from steady arrivals that simply do not convert. The first points at traffic quality, the second at your offer or landing page.
- Check the direction of travel. Pull the same report for the previous period. A source that is steadily improving deserves a bid adjustment; one that is steadily decaying deserves a harder look.
- Decide the action per row. Cut, cap, keep or scale — one decision per source, written down, so you can audit it later.
- Re-measure on clean data. After the changes take effect, compare only periods that come after the cut. Mixing pre-change and post-change data is how buyers convince themselves a change worked when it did not.
Cut, Cap, Keep or Scale: A Simple Decision Framework
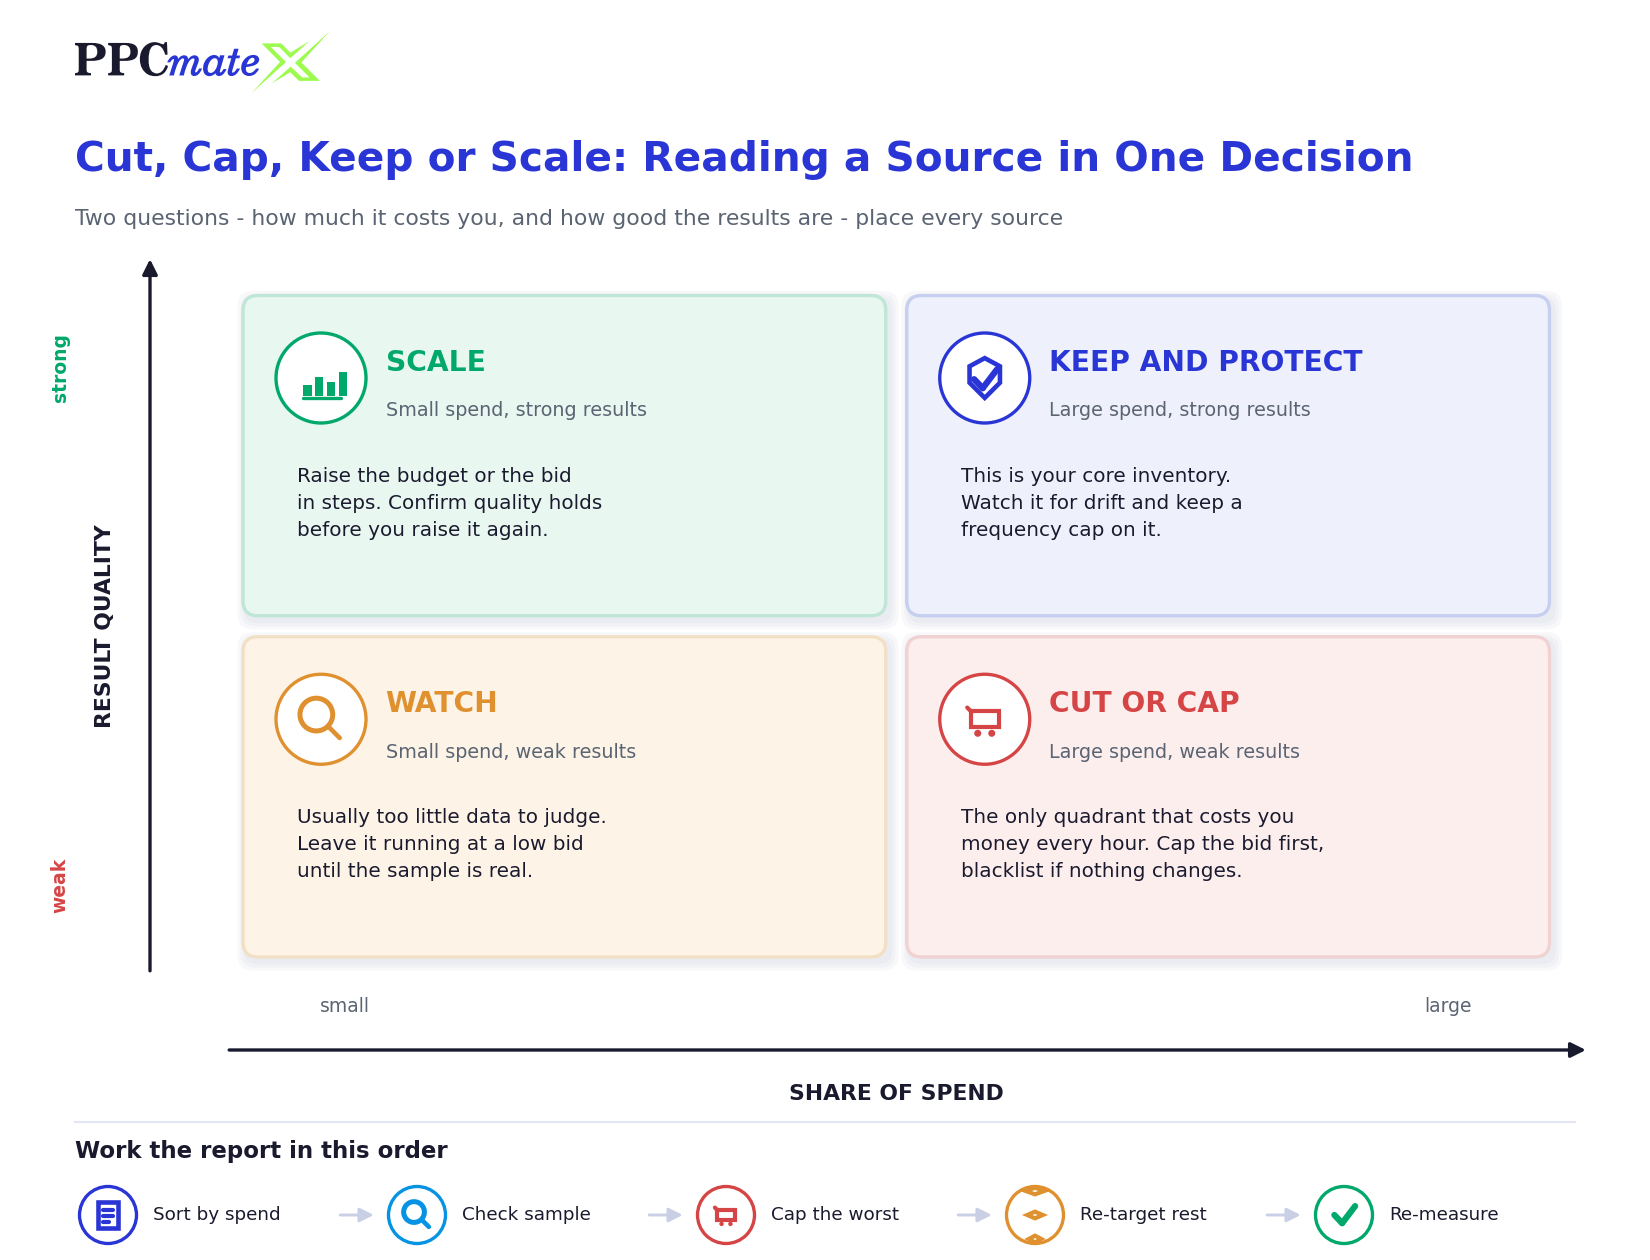
Two questions decide almost every row: how much of your budget is this source taking, and how good are the results it returns? Plotting those two against each other gives you four clear verdicts.
| Verdict | What the row looks like | Action to take | Risk if you get it wrong |
| Cut or cap | Large share of spend, results well off target, no sign of improvement | Lower the bid first; blacklist if the economics still do not work | Cutting on a short window can remove a source that was simply lagging |
| Watch | Small spend, weak or absent results, not enough data to judge | Leave it running at a low bid until the sample is real | Blacklisting unproven rows shrinks your reach for no measured gain |
| Keep and protect | Large share of spend, results at or better than target | Hold the bid, cap frequency, monitor for drift week to week | Over-pushing a core source burns out its audience |
| Scale | Small share of spend, results comfortably better than target | Raise the bid or budget in steps and re-check quality after each step | Scaling too fast usually buys a worse slice of the same source |
The framework is deliberately blunt, and that is the point. Most wasted spend is concentrated in one quadrant, and working that quadrant first delivers more improvement than fine-tuning the rest of the report.
When a Source Deserves a Second Chance
Cutting is permanent in practice, because a blacklisted source rarely gets revisited. Before you remove one for good, consider whether any of these apply:
- The source was tested with only one creative, or with a creative that did not suit the format.
- Your bid was set high enough that even reasonable traffic could not clear the target.
- The test ran over an unusual period — a holiday, a promotion, or a stretch when your landing page was slow or broken.
- You were buying it broadly when it only performs on a specific geo, device or daypart.
- The weak numbers came from a period before you tightened your whitelist and blacklist targeting.
If one of those is true, a re-test with the variable changed is usually more valuable than a permanent block. If none of them is true and the source still fails on a fair sample, cut it and move on.
How Often Should You Prune Your Source List?
Pruning too often is its own problem. Every cut shrinks your addressable inventory, and a list trimmed daily on thin data ends up narrow, expensive and fragile. A practical rhythm is to check the top spenders frequently for obvious breakage, and to run the full cut-cap-keep-scale pass on a slower cadence that matches how long your offer takes to convert.
Between passes, watch for the signals that justify an immediate intervention: a source that suddenly takes a much larger share of budget than usual, a sharp change in click behaviour without a matching change in results, or delivery patterns that do not look human. Those are worth acting on the same day. Everything else can wait for the scheduled review, where you will have enough data to be right.
Common Mistakes to Avoid
- Cutting on clicks instead of outcomes. Click-through rate tells you about attention, not value. Sources with modest click rates and strong conversion rates are exactly the ones you want to keep.
- Judging rows with almost no data. A source with a handful of impressions and no conversions is unproven, not proven bad.
- Blacklisting before adjusting the bid. Many “bad” sources are simply sources you were overpaying for. A price change is reversible; a blacklist tends not to be revisited.
- Ignoring the trend. A snapshot cannot tell you whether a source is recovering or decaying. Always compare against the previous period.
- Confusing invalid traffic with weak traffic. These need different responses — one is a supply integrity issue, the other is an optimisation problem. Our guides on bot traffic versus low-quality traffic and ad fraud and invalid traffic cover how to tell them apart.
- Cutting so aggressively that reach collapses. An over-pruned list drives up your effective price and starves the campaign of the volume it needs to learn.
- Not re-measuring after the change. If you never check whether the cut helped, you are collecting habits rather than evidence.
- Reading delivery figures without checking whether ads were seen. Low viewability can make an otherwise reasonable source look like a performance failure.
Turn Your Report Into Campaign Changes
Reading the report is only half the job — the value comes from acting on it quickly and being able to see whether the action worked. That means source-level reporting and source-level controls need to live in the same place, so a decision you make in the report can become a bid change, a cap or a blacklist entry without exporting anything.
PPCmate X gives advertisers self-serve source-level reporting alongside the targeting and bidding controls needed to act on it, across display, native, video, push and pop traffic. If you would rather have some of those decisions applied on a schedule instead of by hand, our campaign automation tools can carry the repetitive part of the pass for you.
Frequently Asked Questions
What is a source-level report?
A source-level report breaks a campaign down by the individual places the ads ran — websites, apps, zones or publisher IDs — and shows the spend, delivery and results for each one. It is the view that reveals which specific inventory is producing your results and which is only producing cost.
How much data do I need before cutting a traffic source?
Enough spend that the source would have produced several conversions if it were performing at your target rate. Below that, the row is unproven rather than bad. The exact threshold depends on your cost per result, so calculate it from your own target instead of using a fixed impression count.
Should I lower the bid or blacklist a poor source?
Lower the bid first in almost every case. Many underperforming sources are simply priced wrong for you, and a bid change is reversible. Reserve blacklisting for sources that still fail after a fair price test, or that show signs of invalid traffic.
How often should I review source-level performance?
Check your top spenders often enough to catch sudden breakage, and run a full review on a cadence that matches your conversion delay. Reviewing the whole list daily usually means acting on noise and over-pruning your inventory.
What is the difference between a source-level report and a placement report?
They describe the same idea at different levels of detail. A source is usually the publisher or supply origin, while a placement can be a specific ad slot within it. Some platforms use the terms interchangeably; what matters is the granularity of the rows you are given.
Why do some sources get clicks but no conversions?
Common causes include accidental or incentivised clicks, a mismatch between the ad promise and the landing page, poor mobile page performance, or invalid traffic. Checking whether the clicks turn into actual landing page arrivals is the fastest way to separate these explanations.
Can I rely on a whitelist instead of reading the report?
A whitelist is the output of this process, not a replacement for it. Source performance drifts as inventory, audiences and seasonality change, so a list that is never re-read gradually stops reflecting reality.
Does cutting sources reduce my campaign reach?
Yes, and that is why pruning needs discipline. Every cut removes inventory you can buy, so the goal is to remove the sources that are demonstrably losing money rather than to make the list as short as possible.