Most “average CPM” lists online are guesses, or they’re copied from a network’s rate card. This post uses real data instead: what advertisers actually paid on PPCmate over the last 30 days, broken down by country, format and device.
How we measured it
- CPM is what advertisers paid per 1,000 valid impressions. For push, we also show the CPC, because push is usually bought per click.
- We only counted traffic that passed our filters. Impressions we flagged and didn’t charge for are left out.
- A country is only included if at least 3 different advertisers bought there, so one big buyer can’t skew the number.
- All prices are in USD. Period: September 30 – October 29, 2026.
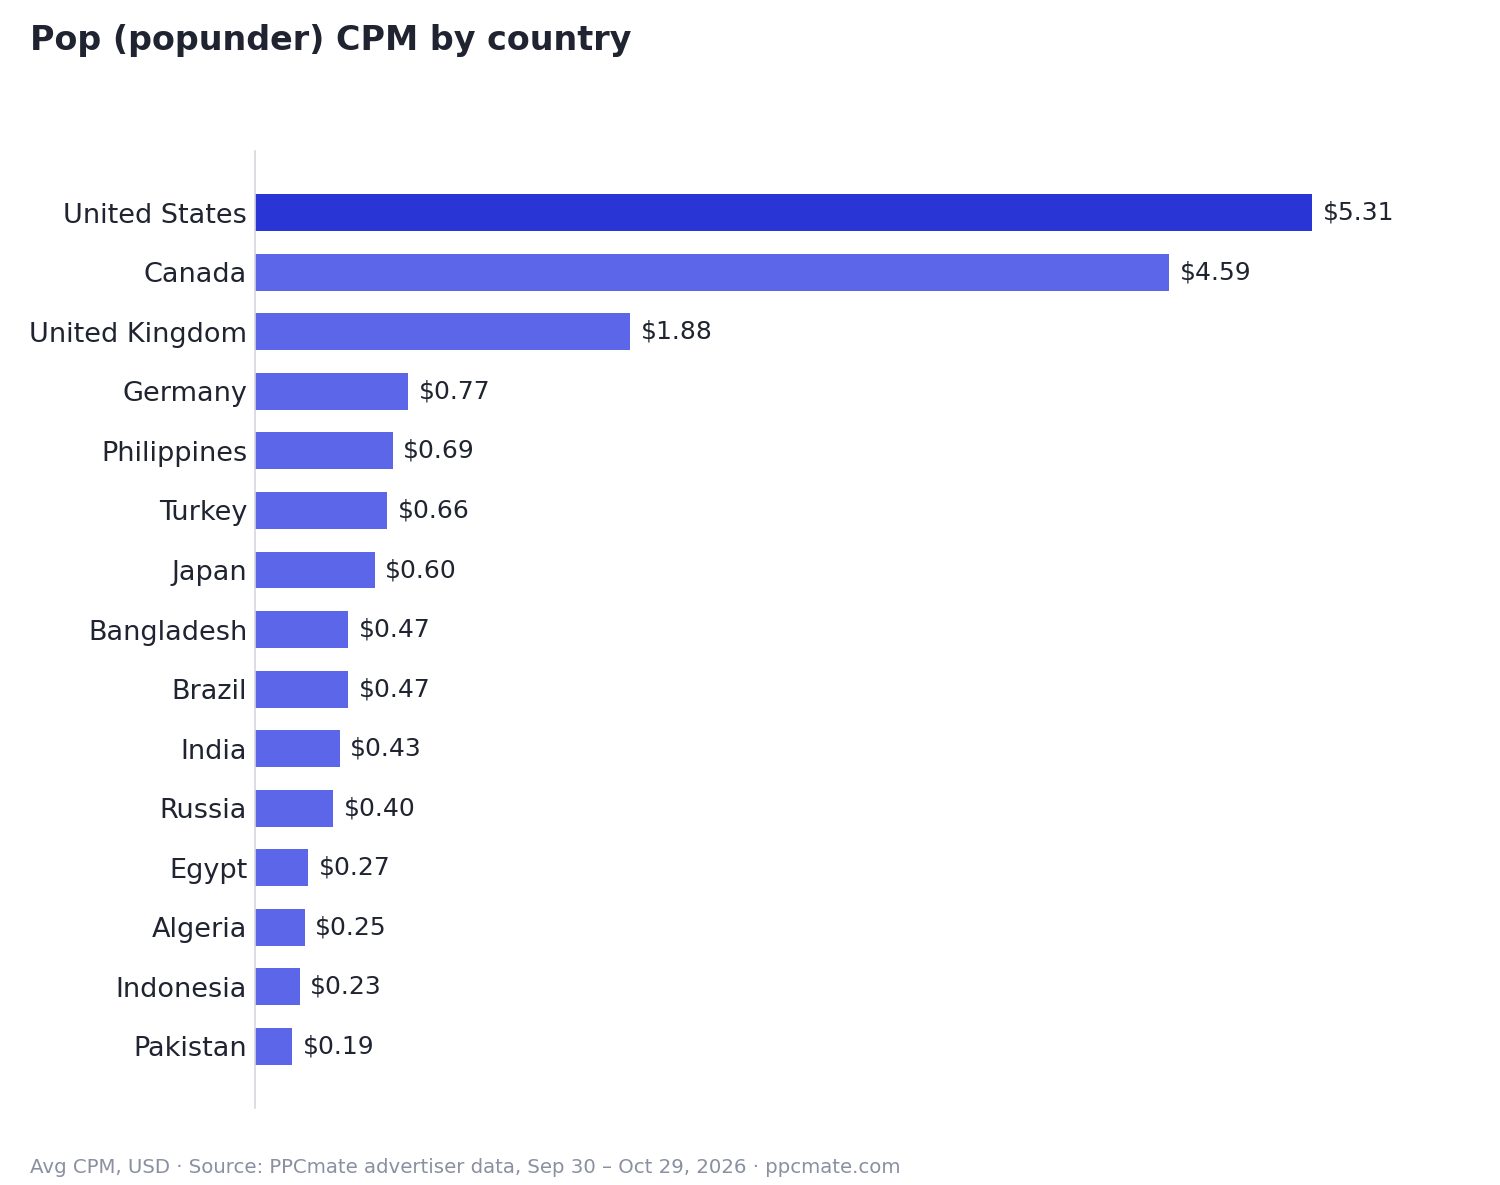
Pop (Popunder) CPM by Country
| Country | Avg CPM |
|---|---|
| United States | $5.31 |
| Canada | $4.59 |
| United Kingdom | $1.88 |
| Germany | $0.77 |
| Philippines | $0.69 |
| Turkey | $0.66 |
| Japan | $0.60 |
| Bangladesh | $0.47 |
| Brazil | $0.47 |
| India | $0.43 |
| Russia | $0.40 |
| Egypt | $0.27 |
| Algeria | $0.25 |
| Indonesia | $0.23 |
| Pakistan | $0.19 |
What stands out
- The US and Canada cost 2–3x more than the UK. If you’re testing an English-language offer, the UK is a cheap first market.
- Japan is surprisingly cheap for a tier-1 country, at about $0.60. It’s worth testing if your offer works in Japanese.
- The tier-3 markets (Pakistan, Indonesia, Algeria, Egypt) sit at $0.19–0.27. That’s good for volume testing, but judge them on conversions, not on how cheap the clicks are.
Mobile vs desktop pop
| Device | Avg CPM |
|---|---|
| Mobile | $2.09 |
| Tablet | $1.65 |
| Desktop | $1.34 |
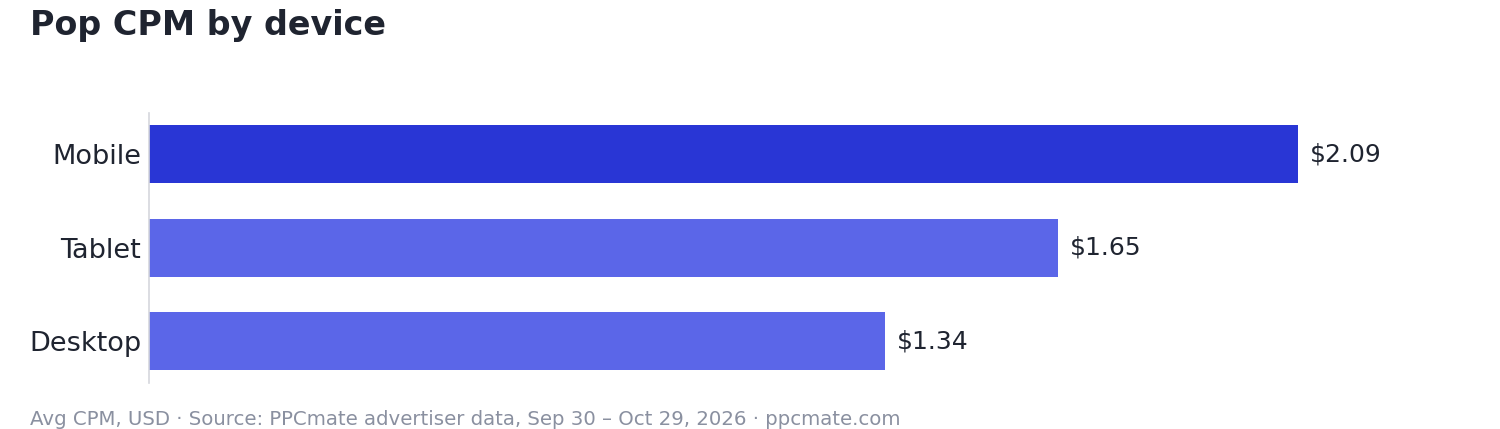
Mobile pop costs about 55% more than desktop across all countries. That’s partly because more tier-1 traffic is on mobile. Always split your campaigns by device so one doesn’t hide the other’s results.
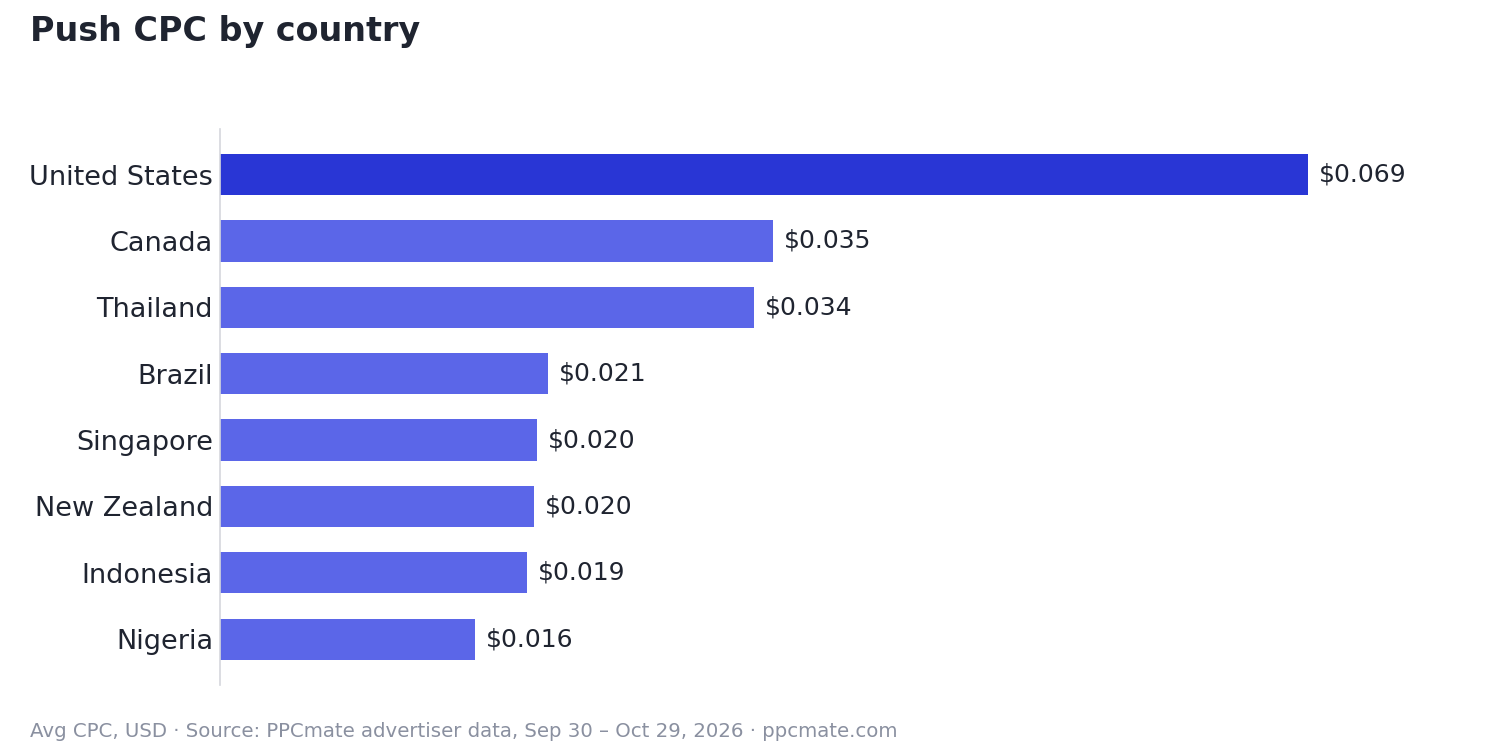
Push CPC by Country
| Country | Avg CPC |
|---|---|
| United States | $0.069 |
| Canada | $0.035 |
| Thailand | $0.034 |
| Brazil | $0.021 |
| Singapore | $0.020 |
| New Zealand | $0.020 |
| Indonesia | $0.020 |
| Nigeria | $0.016 |
Push clicks in the US cost about 3.5x more than in Brazil or Indonesia. US push also gets clicked far more often: around 3.3% CTR, against well under 1% in most tier-3 markets. So the higher price buys more engaged users, not just a more expensive click.
How to Use These Numbers
- Start at or a little above the average. If you bid below these numbers, you’ll mostly get leftover inventory.
- Split by country and device from day one. The US and Pakistan in one campaign gives you a meaningless blended CPM.
- Judge on cost per conversion, not CPM. A $0.20 CPM market that never converts is more expensive than a $5 one that does.
- Raise bids on the sources that work, not across the whole campaign. Per-source bids let you pay more only where it pays off.
Want Live Prices for Your Offer?
These are averages. The real price depends on your bid, targeting and creative. You can see live competition for any country in the PPCmate dashboard before you spend anything, and the minimum deposit is $25. New advertisers get a 20% bonus on their first deposit with the code PPCMATE20.
We’ll update these benchmarks every quarter. Feel free to cite this data with a link back to this page.