Key performance indicators, or KPIs, are used across almost every industry as a metric of how well something is or isn’t working.
In PPC, you can use KPIs to determine how successful your campaigns were.
Understanding the key indicators of campaign performance is essential for anyone working in PPC right from the get-go. The goal of every single PPC campaign should be matched to different KPIs first during the campaign planning phase.
Knowing what your campaign is trying to achieve and how you will measure it will allow you to set up Google Analytics and Google Ads ahead of time, ensuring you are measuring performance properly from day one and securing the integrity of your campaign results.
Proper measurement of your campaign performance is the only way to demonstrate ROI both to your clients and to your employer.
Here are the 10 most important PPC KPIs to use.
1. Clicks
Every conversion starts with a click. That’s why clicks are an early indicator of PPC campaign success.
This KPI measures how many people clicked on your ad.
Campaign managers often check in on accounts throughout the month to pause ads that are not performing and even increase the bids on ads that are.
Clicks are a great KPI for that mid-month account performance checkup; however, the success of a campaign shouldn’t be determined solely by clicks.
2. Click-Through Rate (CTR)
Similar to measuring how many clicks your campaign generated, CTR is a key metric for campaign performance.
CTR is measured by dividing the total number of clicks your campaign got in the month (or period being reported) by its total impressions. This equation tells you that out of say 1,000 impressions, your ad was clicked 100 times, and your CTR is 10%, for example.
Knowing what CTR is and how to measure it is key to being able to indicate your performance, but keep in mind that there is no perfect CTR campaign managers should be striving for.
PPC performance varies by industry and a number of other campaign variables.
For example, WordStream found that the average CTR in search was 4% in the auto industry versus 6.05% in the dating and personals industry.
Campaign managers running campaigns in the U.S. could use the numbers reported by WordStream to benchmark their own CTR success, but should be wary of other variables not accounted for in the analysis like budget spend – but it’s a place to start.
Benchmarking and improving the CTR of different campaigns is important not just as a measure of success, but also because it can affect other KPIs like Quality Score.
3. Quality Score
Quality Score is the most elusive KPI amongst PPC advertisers.
It is a metric created by Google that tells them how relevant your ad content is, using metrics like CTR and other performance variables like landing page experience.
Advertisers find it difficult to understand Quality Score because it’s less straightforward than other easily measured KPIs, like clicks.
Using the expected CTR, landing page experience, ad relevance, and ad format, Google is able to determine a campaign’s Quality Score.
Google is transparent about how Quality Score is measured by their team and why it’s necessary. Hal Varian, Google’s Chief Economist, explains how Quality Score works in the Google Ads auction in this popular video.
Google improved how Quality Score was reported in Google Ads in 2017, but it still comes down to this simple fact:
- A good Quality Score (between 7 and 10) means you pay less money to advertise with Google Ads.
- A bad Quality Score (6 or lower) means you pay more money.
Google’s changes to Quality Score reporting made Quality Score easier for advertisers to use in Google Ads and began providing historical data about the KPI as well. These insights give advertisers the necessary information to make smarter campaign decisions.
Despite the confusion, advertisers remain extremely interested in improving Quality Score because it determines how much they pay for each click. In turn, Quality Score can affect other KPIs such as CPC and CPA.
4. Cost Per Click (CPC)
PPC advertisers know how much they can pay for an ad campaign because they typically have a predetermined budget.
However, while they specify a budget and a bid when doing the setup of a PPC campaign, it doesn’t mean that this is what they will pay.
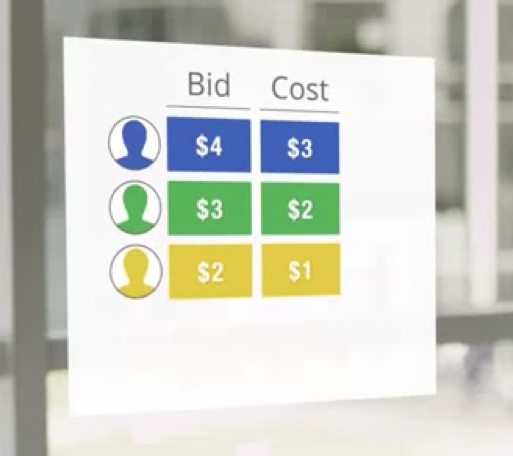
Advertisers outcompete competitors for ad positions with their bid but pay the next highest bid price. The image below demonstrates this concept:
Therefore the cost of putting up an ad and for the clicks it generates is largely determined by other competitors in the PPC auction.
CPC measures exactly how much an advertiser has paid. You can measure CPC by dividing the total cost of a campaign by the number of times the ad was clicked in that campaign.
If you want to manually check the cost of your campaign, you could multiply CPC by the number of clicks a campaign received.
5. Cost Per Conversion/Acquisition (CPA)
Similar to CPC, you can set a cost per acquisition (CPA) when you set up your advertising campaigns.
Google defines the average CPA as the price advertisers pay for every new customer they acquire, which is calculated by dividing the total cost of conversions by the number of conversions. Google determines the CPA based on your Quality Score.
However, there is a bit more to the CPA story.
While average CPA is pretty easy to digest, advertisers can also make use of Targeted CPA, a bidding technique applied during campaign setup.
Targeted CPA helps advertisers set bids automatically to get as many conversions as possible, based on a set CPA determined by the advertisers’ budget.
However, to make use of targeted CPA, you have to understand different bidding strategies, set up conversion tracking, and have at least 30–50 conversions in the last 30 days.
6. Conversion Rate (CVR)
Conversion rate is not only an indicator of campaign success, but it is also the reason PPC marketers are hired in the first place.
You can measure conversion rate in Google Ads by dividing the number of conversions the campaign received by the total clicks.
Since conversion rate is expressed as a percentage, if the campaign had 100 clicks and 10 conversions, 10/100 means that the conversion rate would be 10 percent.
While campaign managers always have an eye on conversions, they will often set up campaigns to optimize for clicks rather than conversions.
You can now aim for conversions based on CPA goals rather than focusing on clicks or impressions. However, to be eligible to optimize for conversions, your account must have had at least 15 conversions in the last 30 days.
7. Impression Share (CPM)
An impression occurs when a person sees your ad. It doesn’t matter whether they click on it.
Looking at how many impressions a campaign generated isn’t an indicator of success because it doesn’t express how many people found your ad effective.
However, impression share does add context to the reporting story by stating how much of the total impressions your ad campaigns are getting.
Determined by dividing the total impressions your campaign received by the total number of impressions your campaign was eligible for, Google says:
“Eligible impressions are estimated using many factors, including targeting settings, approval statuses, and quality. Impression share data is available for campaigns, ad groups, product groups (for Shopping campaigns), and keywords.”
Impression share gives marketers indirect competitive insight. Knowing that you have a 50% impression share for a keyword, tells you that your competitors own the other 50 percent.
If you increase your impression share, you are decreasing the number of times your competitors’ ads are shown. If you’re looking to increase their impression share, you’ll have to increase your bids and/or budgets.
8. Average Position
Google balances both paid, and organic search results for almost every search query entered.
Ads on Google or Bing can show at the very top of the search engine results page (SERP) in position 1, right underneath the next ad shown is in position 2, and so on.
Average position tells advertisers which position their ad is shown in most of the time. Google can’t simply give the highest bidder the first position all the time, so they determine the average position based on ad rank.
Ad rank is calculated by multiplying Quality Score by an advertiser’s max cost per impression (CPM).
However, since the average position is indeed an average, even knowing how to calculate it isn’t the full story since if your average position was 3, you may have been in positions 1, 4, and 6 earlier that day.
Since the first 1-3 ads are shown before even the organic search results, everyone worked so hard on, many businesses advertising on Google would like to be visible right out of the gate in position 1.
It makes sense to want to be in the first position, but the aim to do so is mostly one of vanity because being in the first position doesn’t necessarily mean results.
Some advertisers may have more conversions in position 4 than position 1 for whatever reason. You should use the average position to provide context around campaigns and campaign reporting, but it shouldn’t be used as a target indicator.
9. Budget Attainment
Paid search marketers are almost always given a monthly budget to run ad campaigns with. Budget attainment measures how closely that agency or individual came to achieving the budget they set out to.
Most PPC marketers don’t consider budget attainment when it comes to measuring their PPC performance, despite how much information it provides on how campaigns are being managed.
The reason why marketers tend to overspend or underspend the budget every month is that it’s difficult to bid consistently and maximize results with ongoing fluctuations in the PPC auction – a task that requires ongoing oversight and optimization (without the use of machine learning).
Regardless, I’m making the case that budget attainment is a KPI that PPC marketers need to think about.
10. Lifetime Value
LTV is a broad indicator of account health and a PPC marketer’s abilities.
But calculating customer lifetime value for paid search is complex.
Companies that retain customers acquired via paid search longer will make significantly more revenue.
While LTV is a measure of a business’s customer’s lifetime with their product and/or services, it can be measured in different ways.
For example, in the case of a martech provider, LTV could be measured simply by looking at the number of days, months, or years a client stayed with the platform.
In the case of a large company like Starbucks, measuring LTV can actually be quite complex. There are numerous considerations (e.g., average customer lifespan, customer retention rate, profit margin per customer, and applied discounts).
While PPC marketers typically wouldn’t take on complex calculations of LTV like Starbucks, knowing how this KPI is measured in other departments could certainly come in handy.
Just be aware that LTV means slightly different things to different marketers, but is fundamentally the same across all of them.
Reporting on PPC KPIs
KPIs are not mutually exclusive.
It’s unlikely that the performance on one indicator is the best it has ever been, while others are the worst.
For instance, you wouldn’t expect to have a super high CTR and a low Quality Score because the two are related. They tell different parts of the same story.
Improving CTR can positively impact Quality Score, and improving Quality Score can positively impact cost per click and cost per acquisition, in turn creating more profitable PPC campaigns for customers who stay longer.
With all of this in mind, it’s important that advertisers begin improving their performance at the level of clicks, while also making sure to not get caught up in one single number and remembering to take a step back and look at the KPIs that paint a more complete picture, like LTV.
While it’s nice to report on every metric included above, KPIs should be assigned to a campaign based on what makes the most sense for the client and their goals.
Stick to what clearly indicates progress according to your clients’ standards and don’t overload them with extra KPIs just to look good – less is more when it comes to client reporting.
___
by Chandal Nolasco da Silva
source: Search Engine Journal


